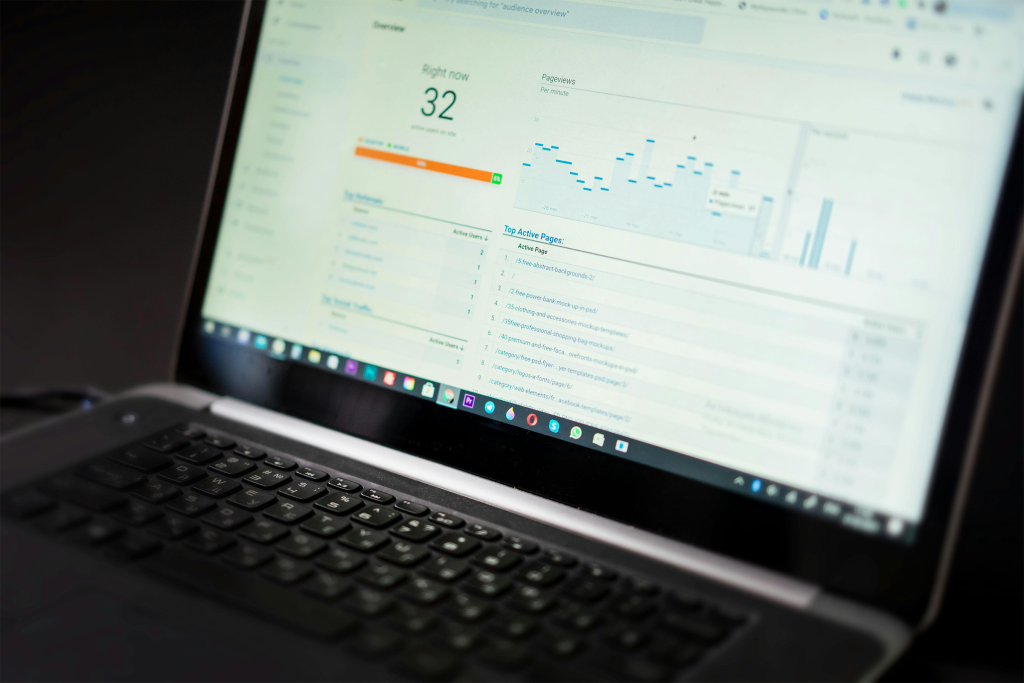
Firely Server Metrics Dashboard
Instant insights into performance, health, and activity — so you can detect and resolve issues faster.

Real-time insights for smarter performance monitoring
The Firely Server Metrics Dashboard gives you real-time visibility into your Firely Server’s performance and health all in one view.
With our new SMART on FHIR powered app, you’ll have key metrics at your fingertips:
- Server activity and performance trends
- System health (CPU, memory)
- How many requests succeed or fail
- Ingestion rates from the FHIR REST API, Firely Server Ingest (FSI) and Firely PubSub
- Availability status of different server components
Explore the Firely Server Metrics Dashboard


The dashboard helps you quickly spot issues, troubleshoot faster, and gain insights into server usage and performance.
Interested? Fill out the form below to request your Metrics Dashboard.